Findings
1. The classical fusion pattern was reproduced
The qualitative single-SQI hierarchy was broadly recovered. For predefined feature subsets, accuracy again peaked at the five-SQI combination and did not improve when all seven SQIs were included.
| Predefined subset | Paper accuracy | Reproduced accuracy |
|---|---|---|
| iSQI + basSQI | 0.945 | 0.900 |
| bSQI + basSQI + pSQI | 0.948 | 0.931 |
| bSQI + basSQI + kSQI + sSQI | 0.948 | 0.944 |
| Five-SQI paper subset | 0.949 | 0.948 |
| All seven SQIs | 0.946 | 0.939 |
The claim remains functional because the original adjudicated labels were not available.
2. Fixed synthetic balancing created a source shortcut
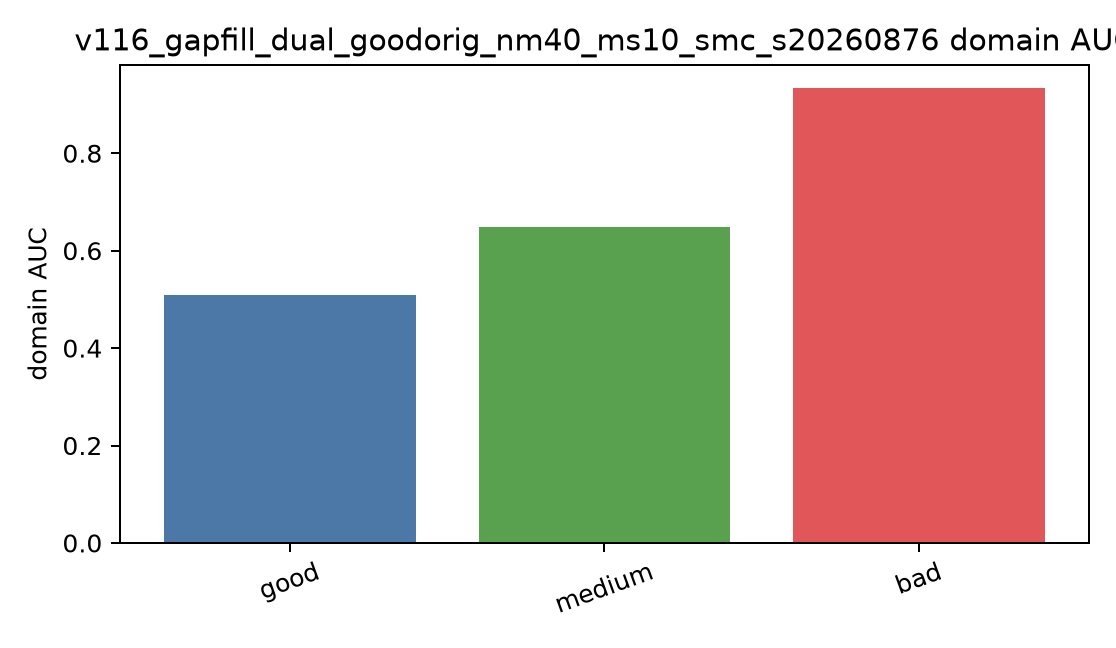
Synthetic records formed 70.9% of the reproduced poor class. Native and fixed synthetic poor records were strongly separable in SQI space (AUC 0.974), while training on combined synthetic poor transferred weakly to native poor records (AUC 0.583). Near-paper aggregate accuracy therefore did not imply equivalent generalisation to naturally poor ECGs.
3. Support-aware construction repaired most of the failure
| Audit | Fixed synthetic | SMC construction |
|---|---|---|
| Raw-waveform source classifier | 0.9970 | 0.8129 |
| 84-SQI source classifier | 0.9572 | 0.7973 |
| Transfer AUC | 0.8880 | 0.9294 |
| Poor recall at 95% acceptable specificity | 0.0759 | 0.7321 |
The matched-random control showed that broader, constrained candidate coverage created most of the gain. SMC added further alignment in task-relevant SQI space; it did not make generated and native distributions equivalent.
4. Temporal representation improved the difficult boundary
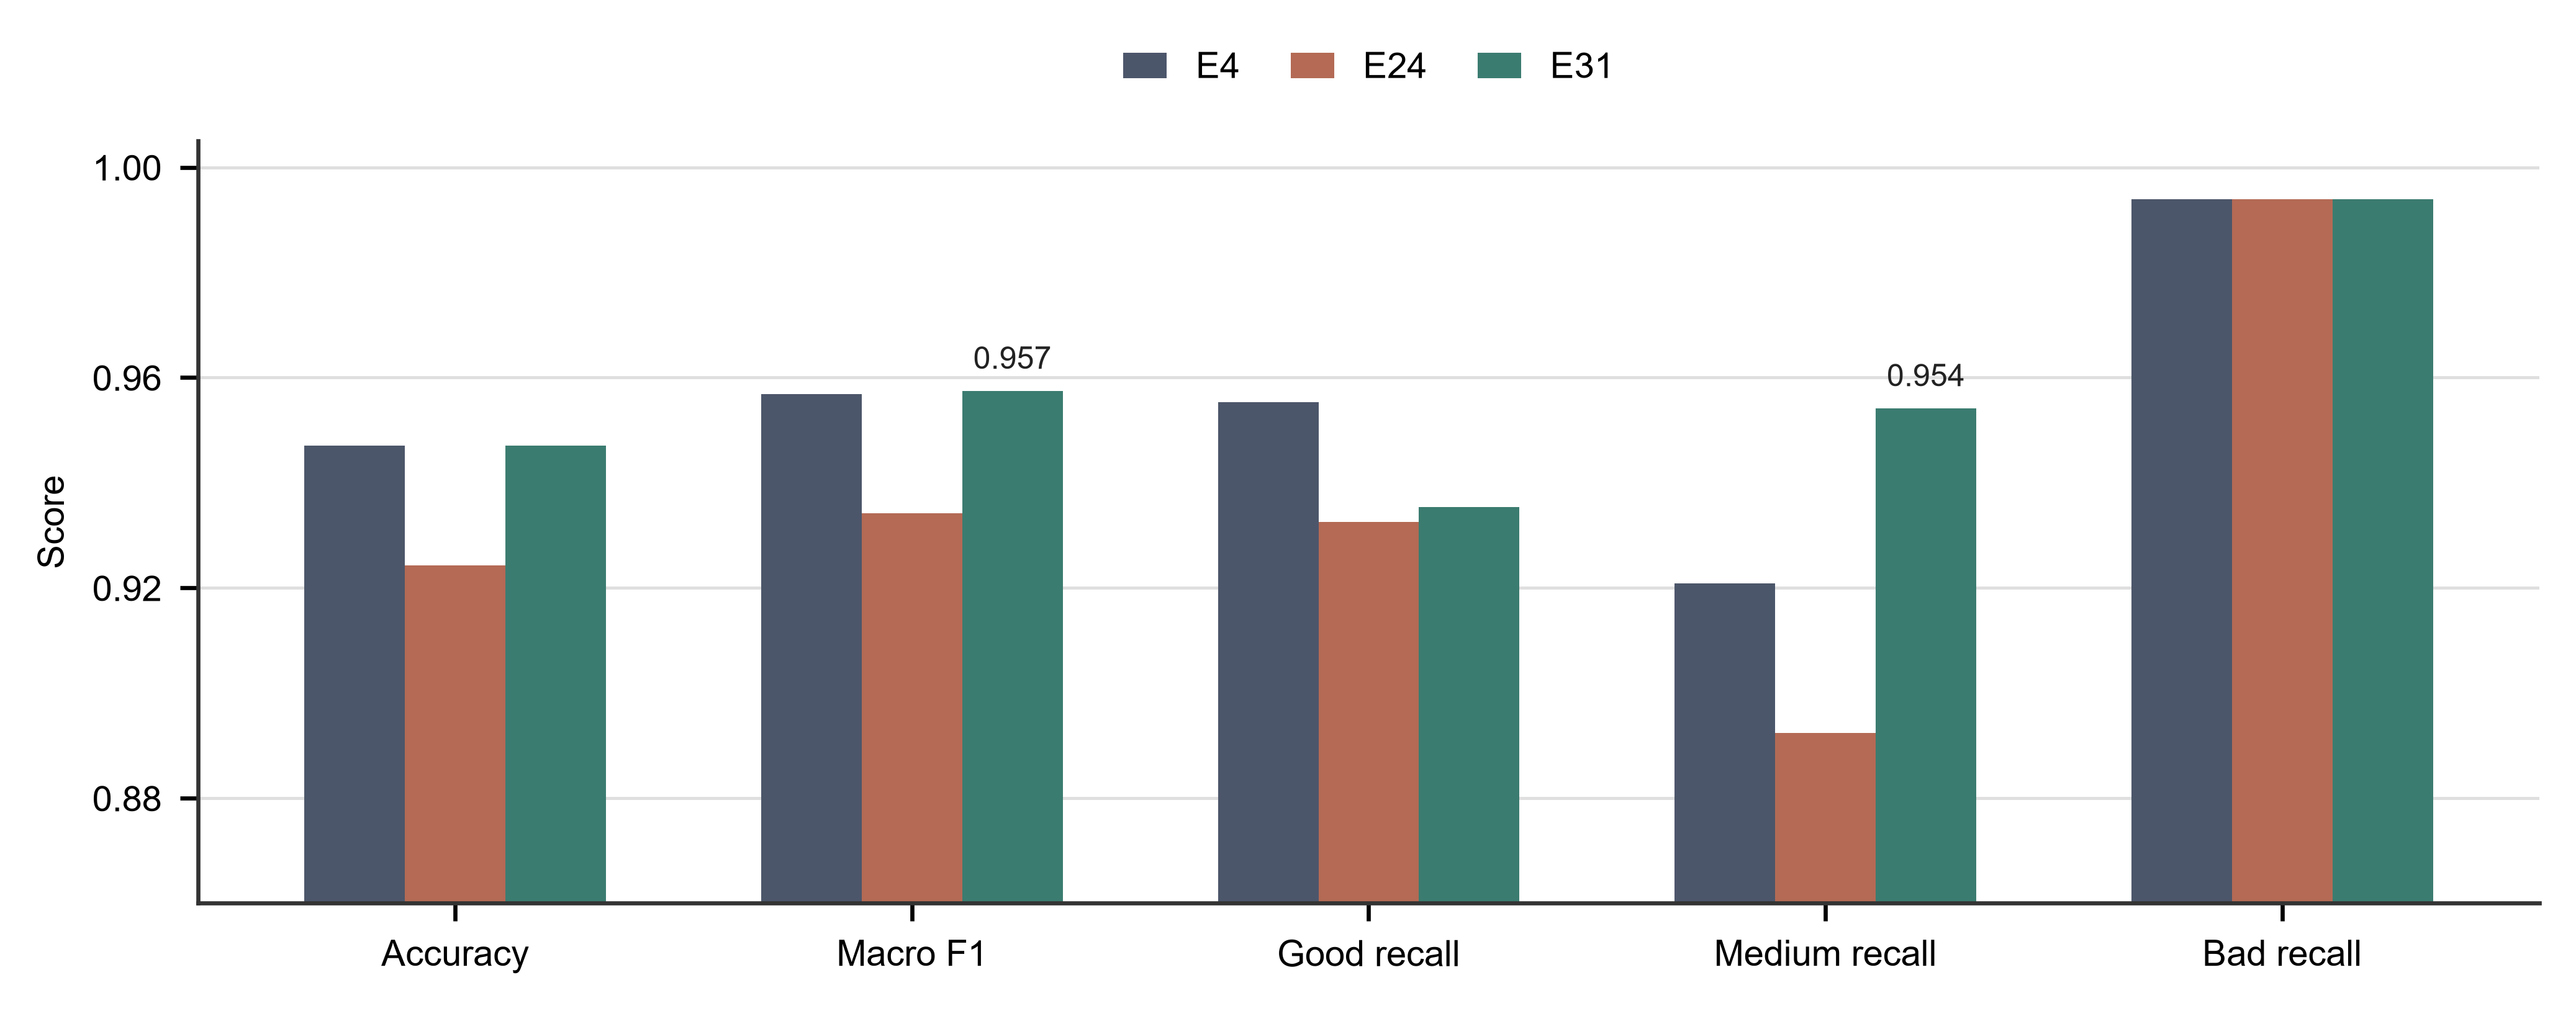
On BUT QDB, Medium recall increased from 0.7563 with global LM-MLP to 0.8259 with local SQIs and 0.9077-0.9256 across waveform models. Most remaining errors were Good-Medium confusions; Bad recall was already high.
| Model | Accuracy | Macro-F1 | Balanced accuracy | Medium recall |
|---|---|---|---|---|
| Global LM-MLP | 0.8691 | 0.8844 | 0.8789 | 0.7563 |
| Local SQI | 0.8886 | 0.9040 | 0.8979 | 0.8259 |
| Matched ResNet | 0.9355 | 0.9466 | 0.9495 | 0.9256 |
| Full Conformer | 0.9284 | 0.9398 | 0.9428 | 0.9198 |
Matched ResNet and Full Conformer were comparable under paired uncertainty. The supported result is therefore a waveform-representation gain, not a universal Conformer advantage.
5. Set-A and BUT support different architecture conclusions
On Set-A, the Full Conformer led selected operating-point accuracy (0.9128), balanced accuracy (0.8536), PR-AUC (0.8583), and poor recall (0.7475). The selected-five SVM retained the highest ROC-AUC (0.9237), showing that ranking and thresholded performance answer different questions.